
PORTFOLIO
Visual Communication
A word about content vs design…
What makes me different from a graphic designer is the deep focus on strategy, change management frameworks, communication principles, systems thinking, and behavioral economics. All of these graphics were created in sync with transformational change initiatives, organizational development and training, and a culmination of facilitation, workshops, and research that I have led. While the content of the graphics belong to their respective organizations, this portfolio showcases my ability to translate important strategic work to a variety of stakeholders. I move easily between executive leadership skills and visual communication as a uniquely effective change leader.
Slide Decks can make or break a presentation—they must be engaging, complement the message, simple, and easy to digest. Training on how to put together compelling slide decks is available, or you can just outsource slide decks to me. Polished & professional will be your new mantra.

SLIDE DECKS
In all strategic planning initiatives, it’s important to assess the market landscape for what signals may impact your organization. We can help with the environmental scan, and provide polished results. Share the findings widely to close the loop with leadership and employees alike.

ENVIRONMENTAL SCANNING
Polished reports that showcase your environmental and market scanning will help all stakeholders understand the landscape in which your organization is situated. Whether your report is 2 pages or 30, a custom design will complement your vision. Credit for this particular design goes to Lori Greenwood, under my leadership.

ENVIRONMENTAL SCANNING REPORT
COMMUNICATION
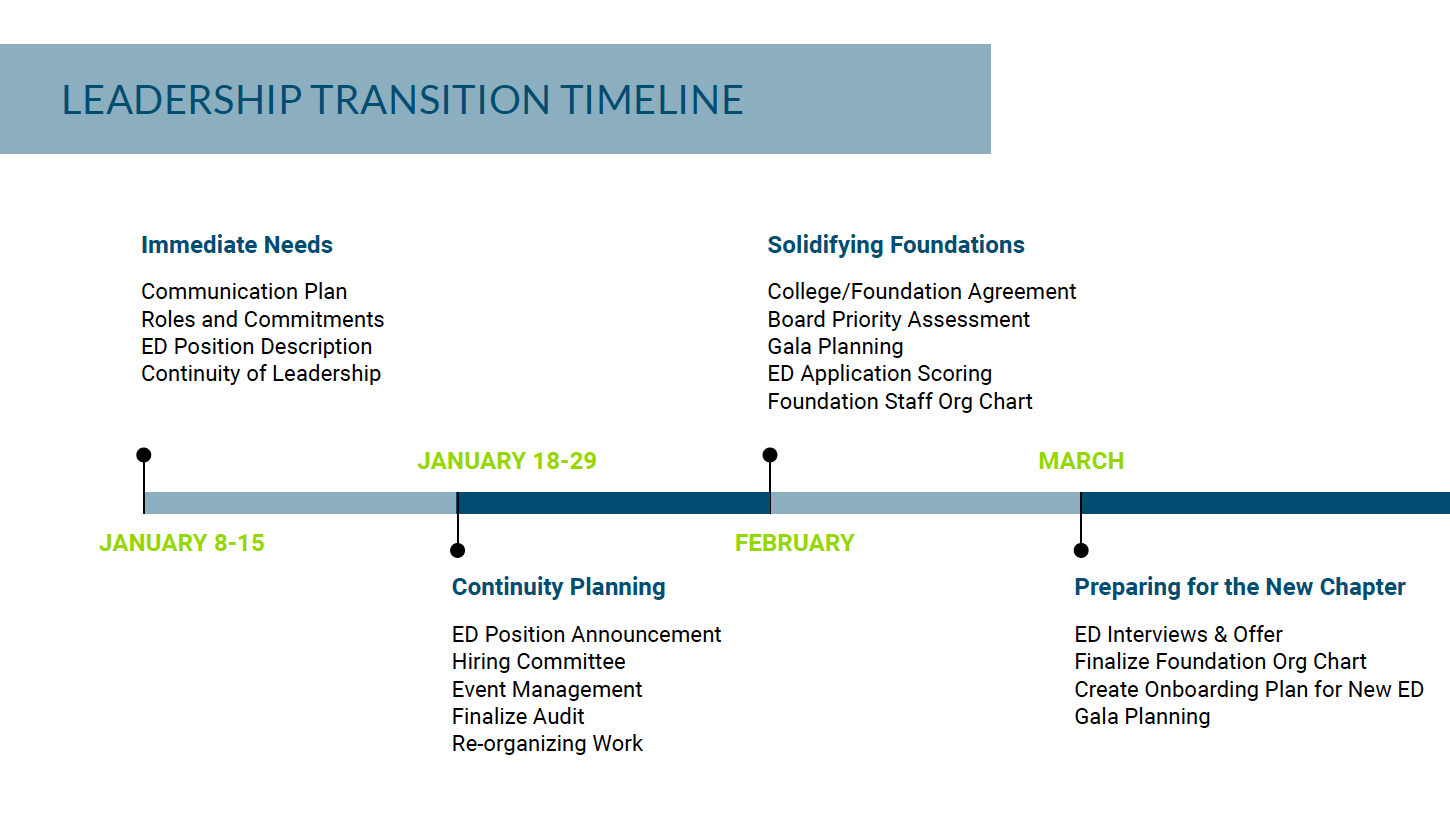
Clearly identify the milestones, the timeline, deliverables, and outcomes in a visual way for communication with all stakeholders. Don’t make the mistake of assuming that everyone knows the plan for an upcoming transition, change, or process improvement. Communication in Leadership is one of many change management trainings available.
Knowing your audience and how to whittle complex information into digestible and clear messaging is a skill. You can request writing samples in a number of styles—data analysis, proposals, contracts, reports, change summaries, creating a business case, grants, policy, and more.

WRITING WITH PURPOSE
Plans need clear actions, objectives, metrics, timelines and status updates. Nitty Gritty details like this can be captured in interactive dashboards, spreadsheets, and documents shared with your need-to-know stakeholders and leaders. Plan logistics can be crafted to your custom environment and strategic priorities.

WORK PLANS
When communicating with very busy stakeholders like legislators and public figures, succinct messages with data and graphics are a welcome communication tool that can be scanned and understood quickly.

LEGISLATIVE COMMUNICATION
A graphic to accompany complex information will boost your message and engagement. This is a new graphic depiction of the MCOD developed by Bailey Jackson, Ed.D. and Rita Hardiman, Ed.D.

INFORMATIONAL MODELS
Bring clarity to your planning processes to increase participation and understanding. Visuals are so important to keeping your employees informed. This is an example of the comprehensive planning model created for a college.

COMPREHENSIVE PLANNING
Make your strategic planning process truly strategic with a fresh update and clear graphics that help people see how their work contributes to the bigger picture. Facilitation and custom models can be crafted to fit your organization.

COMPREHENSIVE PLANNING

CHANGE MANAGEMENT 101
Teaching teams what to expect in transformational change sets you up for success. Training available for all levels of the organization throughout the entire change lifecycle.
Change initiatives can feel complex, especially if they are multi-year projects and it’s important to help your stakeholders see the bigger picture. This success map identifies initiatives by consumer milestones, with an update of what has been accomplished or what year it is due. Included on this map is a brief data summary of why the work is happening and organizational value assumptions.

CHANGE ROADMAP

CHANGE COMMUNICATION
How and when changes are communicated is critical to Organizational Change Management and adoption of change. This is a custom timeline developed for a organization wide data migration process to a new system of record.
FUNDING AND GRANT PROPOSALS
This graphic was a tag-a-long to a funding proposal to communicate impact in a visual and succinct way. You can request samples of grant writing in addition to the graphics that could be developed uniquely tailored to your organization.
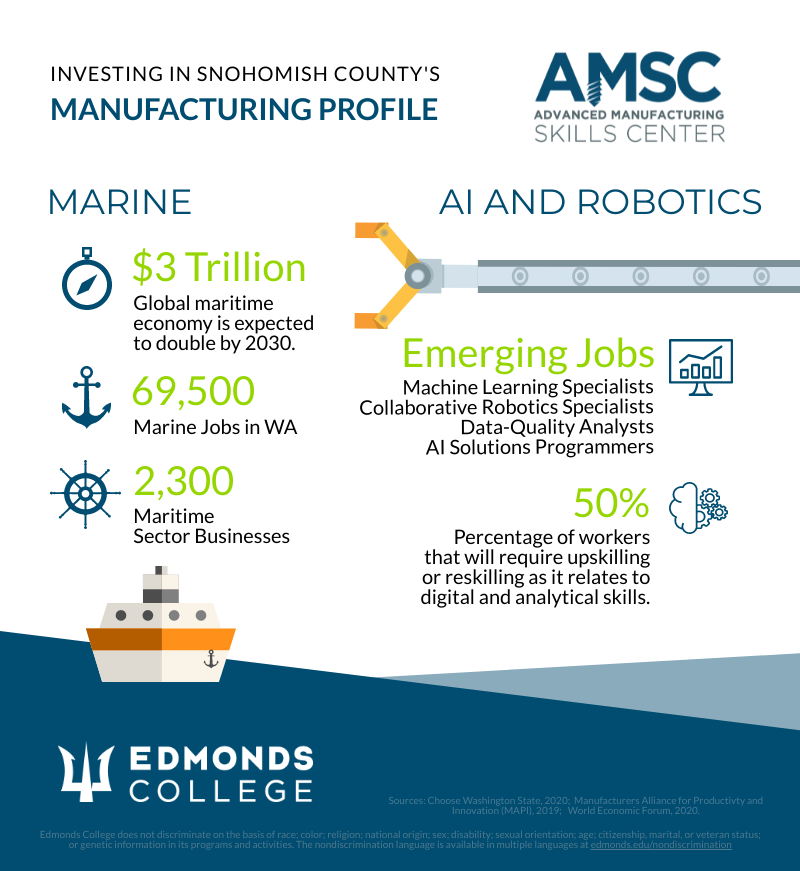
You can educate your audience with facts at a glance to help them understand who you are and what you stand for. Infographics are a great way to create urgency in a change process, and demonstrate why the organization is headed in a particular direction.

CUSTOM INFOGRAPHICS
Icons, color, and graphics can shape how your audience interacts with your content. As an example, at the close of grant initiatives, reports are usually requested that highlight the work done on behalf of the funder. This example set the tone for an entire 125 page booklet with coordinated color and icon placement. Other purposes could include providing accountability reports for non-profits, pitching a project, or to summarize an initiative.

REPORT GRAPHICS

REPORT COVERS
When you are publishing a report, cover art is a great way to make a first impression. The look and feel of this project was continued throughout the document.
Showcasing your data helps you move your audience to action. Help readers connect the data to an urgency to create change. In this case, college student persistence toward a degree.

DATA INFOGRAPHIC
Simple, yet powerful. Sometimes the simplest data point can have a big impact on your audience. This graphic shows just one statistic and graphic to captivate the audience and emotionally connect the reader to the issue at hand.
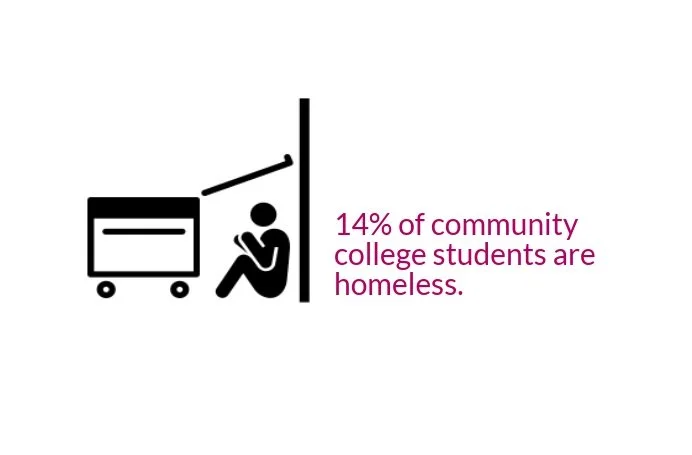
SINGLE DATAGRAPHIC

SINGLE DATAGRAPHIC
Photo + Statistic = gripping emotional reaction for your readers. Urge them to action with strategic data and creative pairings.

SINGLE DATAGRAPHIC
Simple graphics are great compliments to reports, slide decks, or publications.

GRAPHIC MODEL
An illustration can make your point faster than describing it in words. Let me polish your sketch to create a graphic that you can publish with pride.

GRAPHIC MODEL
Graphics can show the relationship between concepts with ease for quick processing by your audience.

GRAPHIC MODEL
Graphics can be created with your company’s colors, branding, fonts, and style.

GRAPHIC MODEL
Speak directly to your audience to complement your text. Graphically represent an idea to reinforce your message and break up the layout.

INFOPOSTER
Part advertisement, part infographic—visual communication is key to helping to captivate your audience with an event, program, or new service. These can be print posters, social media posts, or digital flyers.
POSTER
Graphic design for print posters should be easy to read and communicate information in the simplest way possible. And it should be beautiful.

BANNER GRAPHICS
POST CARDS
5 X 7 Post card for event invitations, mailers, or handouts. Any size cards can be created.


SOCIAL MEDIA POSTS
Online attention span is very brief. Images in a social feed must capture the audience in less than 3 seconds.

BROCHURES
Attractive tri-fold brochure to engage with your audience. Brochures can be designed in any configuration and unique fold template.
Choosing a photograph is just as important as the text you choose on your ad. This ad highlights a volunteer information day with a photo that compliments the message of growth and giving back.

ADVERTISEMENT
Social media sized banners and headers can be used to enhance your online materials and send a quick message to your audience.
SOCIAL MEDIA ADS

Breaking information up into digestible sound bytes in a carousel layout will help with information retention.
Training, teaching, or educating that includes graphics are far more effective in retention. This infographic was created for a mental health therapy practice.

VISUAL LEARNING
WORKBOOKS
This toolkit, or workbook, was designed for a group of leaders learning about legislative advocacy.